
This algorithm returns the skin sea surface temperature in units of °C. The short-wave infrared (SWIR) SST product makes use of the 3.9 and 4 µm spectral bands. MODIS was the first spacecraft radiometer to have multiple infrared bands in the SWIR atmospheric transmission window (bands 20, 22 and 23). This window is more transparent and less variable than that of the LWIR region (bands 31 and 32), making the SWIR region very suitable for the derivation of SST. In addition, by being on the short-wavelength side of the peak of Planck’s function at ocean temperatures, this spectral interval offers a greater sensitivity to changes in the SST than in the LWIR, even though the signal itself is smaller. While some heritage instruments had a single channel in this spectral region and were used in conjunction with the LWIR to retrieve SST (Llewellyn-Jones et al. 1984) and more recently the VIIRS sensors (Minnett et. al. 2014), MODIS was the first and only sensor to date for which SST could be derived solely from the SWIR window (Kilpatrick et. al. 2015). This product is referred to as “SST4” where the “4” indicates the proximity of the bands used to SWIR wavelengths of 4 µm.
Algorithm point of contact: Peter Minnett of the Rosenstiel School of Marine and Atmospheric Science (RSMAS) at the University of Miami.
The MODIS SST4 algorithm and quality assessment are the responsibility of the MODIS Science Team Lead for SST (currently P. Minnett of the Rosenstiel School of Marine and Atmospheric Science (RSMAS) at the University of Miami).
NASA's standard processing and distribution of the SST4 product is performed using software developed by the Ocean Biology Processing Group (OB.DAAC/OBPG). The OB.DAAC generates Level-2 SST4 product using the Multi-Sensor Level-1 to Level-2 software (l2gen), which is the same software used to generate MODIS and VIIRS ocean color products. The TOA brightness temperatures used by the SST4 algorithm are derived from the measured calibrated radiances using Planck’s Equation convolved with the spectral response function of each band. To facilitate processing directly from the L1a files, and eliminate the need to archive the L1b at the OB.DAAC, L2gen uses a radiance to brightness temperature relationship table that is precomputed for the spectral response of each channel. These precomputed tables have been verified to produce identical brightness temperatures to those found in the standard L1b files and are stored locally and loaded during L2 processing at runtime.
Details of the SST4 processing implementation within L2gen are provided in this document. The description is valid for both the NASA standard product distributed by the OB.DAAC and the Physical Oceanography DAAC, where the SST4 files are repackaged according to the Group for high resolution SST (GHRSST) L2p format.
The sea surface temperature derived from measurements of the MODIS infrared radiometers is commonly referred to as the skin temperature of the ocean. This is because the radiance measured by infrared radiometers originates in the surface skin layer of the ocean and not the body of water below as measured by in situ thermometers (Donlon et al., 2007). The thermal skin layer of the ocean is less than 1 mm thick (Hanafin, 2002; Hanafin and Minnett, 2002; Wong and Minnett, 2018) and as a rule is cooler than the underlying water due to vertical heat flux, with the direction of flux typically from the ocean to the atmosphere. Three distinct processes impact near surface ocean temperature gradients: absorption of solar isolation, heat exchange with the atmosphere, and sub-surface turbulence. Generally, at night or when wind speeds are greater than ~6 m/s the relationship between the skin temperature and the subsurface is often quite stable in the mean. It is under these conditions that validation and uncertainty estimates relative to sub- surface in situ buoys are typically reported. The relationship can, however, be very variable under conditions of high insolation, low wind speeds, and reduced sub-surface turbulence (Minnett, 2003; Ward, 2006). A more complete discussion of subsurface SST gradients and SST depth definitions and applications can be found here. The challenge of validating satellite skin SST measures for a climate data record, and the use of ship board radiometers for validation can be found in Minnett (2010), Minnett and Corlett (2012) and Corlett et al., (2014).
The MODIS bands located near 4μm (20, 22, and 23) exhibit high sensitivity (defined as 1/L dL/dT where L is the radiance emitted by the ocean surface and T is temperature) and are placed where the influence of the atmosphere on the top of the atmosphere (TOA) radiances is smaller and somewhat less variable than in other spectral regions where the atmosphere is relatively transmissive. Figure 2 presents spectra of the earth radiance at satellite height from 3 μm to 14 μm wavelengths for three standard atmospheres. Bands in the LWIR between 10μm and 12μm (31 and 32) are located near the maximum emission for the range of SST and placed such that there is a significant difference in the band integrated atmospheric effect, due primarily to water vapor, for the two bands. In contrast the SWIR bands, have minimal water vapor influence, but suffer from reflected solar radiance during daylight. The LWIR bands used in the SST products are influenced by large water vapor radiative effects, especially in tropical air masses (Figure 2).

The current algorithm for computing SST4 is shown below, and is also described in Kilpatrick et. al. (2015). The foundations of the prototype algorithm can be found in the original theoretical basis document, ATBD25 of Brown and Minnett (1999) which can be found here.
The coefficients aij are derived and continuously verified based on match-ups between the satellite retrievals of brightness temperature and field measurements of sea surface temperature. The coefficients are provided to L2gen through external files, which are in a columned ascii format of “sensor, month-start-day, month-end-day, latitude-start, latitude-end, aii0, ai1, ai2, ai3, ai4, ai5” the last several fields of each record contain internal diagnostic data and can be ignored. A link to the MODIS/Aqua SST4 coefficient file is here and the MODIS/Terra SST4 file is here.
MODIS has a unique design and includes a double-sided “paddle-wheel” scan mirror and multiple detectors for each spectral band: ten detectors for each of the 1-km resolution bands, digitized to 12 bits. The terms in red are related to (i) correcting for any potential imbalance between the mirror sides, (ii) reducing any response versus scan angle (RVS) issues that may be present due to imperfectly characterized changes or degradation in the mirror surfaces, and (iii) improving retrievals at the increasingly longer path-length. Beginning with R2014, NASA SST4 products use month of year coefficients derived for distinct atmospheric regions based on latitude bands. R2014 and R2016 used 6 latitude bands in each hemisphere in 20° intervals from 0° to 40°, and then a single large interval from 40° poleward. The current products have coefficients for an additional 7th band north of 60°N to better represent Arctic atmospheres (Kilpatrick et al., 2019b; Jia, 2019; Jia & Minnett, 2020).
To reduce the risk of discontinuities in SST4 at geographic boundaries caused by switching between sets of coefficients, the SST4 of a pixel at latitude, lat, within 2.5 degrees of latitude from a boundary, at latitude, latb, are weighted as a function of latitudinal distance from the transition according to the following formulation.
$$SST4_{lo} = aij_{0} + aij_{1}xBT_{3.9μm} + aij_{2}(BT_{3.9μm} − BT_{4.0μm}) + aij_{3}(sec(\theta − 1)) + aij_{4}(mirror)+aij_{5}(θ*) + aij_{6}(\theta^2)$$ $$SST4_{hi} = aik_{0} + aik{1}T_{3.9μm} + aik_{2}(T_{3.9μm} − T_{4.0μm}) + aik_{3}(sec(θ−1)) + aik_{4}(mirror) + ai_{5}(θ*) + ajk_{6}(\theta^2)$$ $$SST4 = SST4_{lo} + (SST4_{hi} − SS4T_{lo}) * (lat - lat_b + 2.5)/5.0$$The SWIR measurements near 4μm are affected by bright reflective sources, such as sun glint, and by atmospheric scattering. Due to such contamination, the short-wave SST product is not considered valid for daytime use.
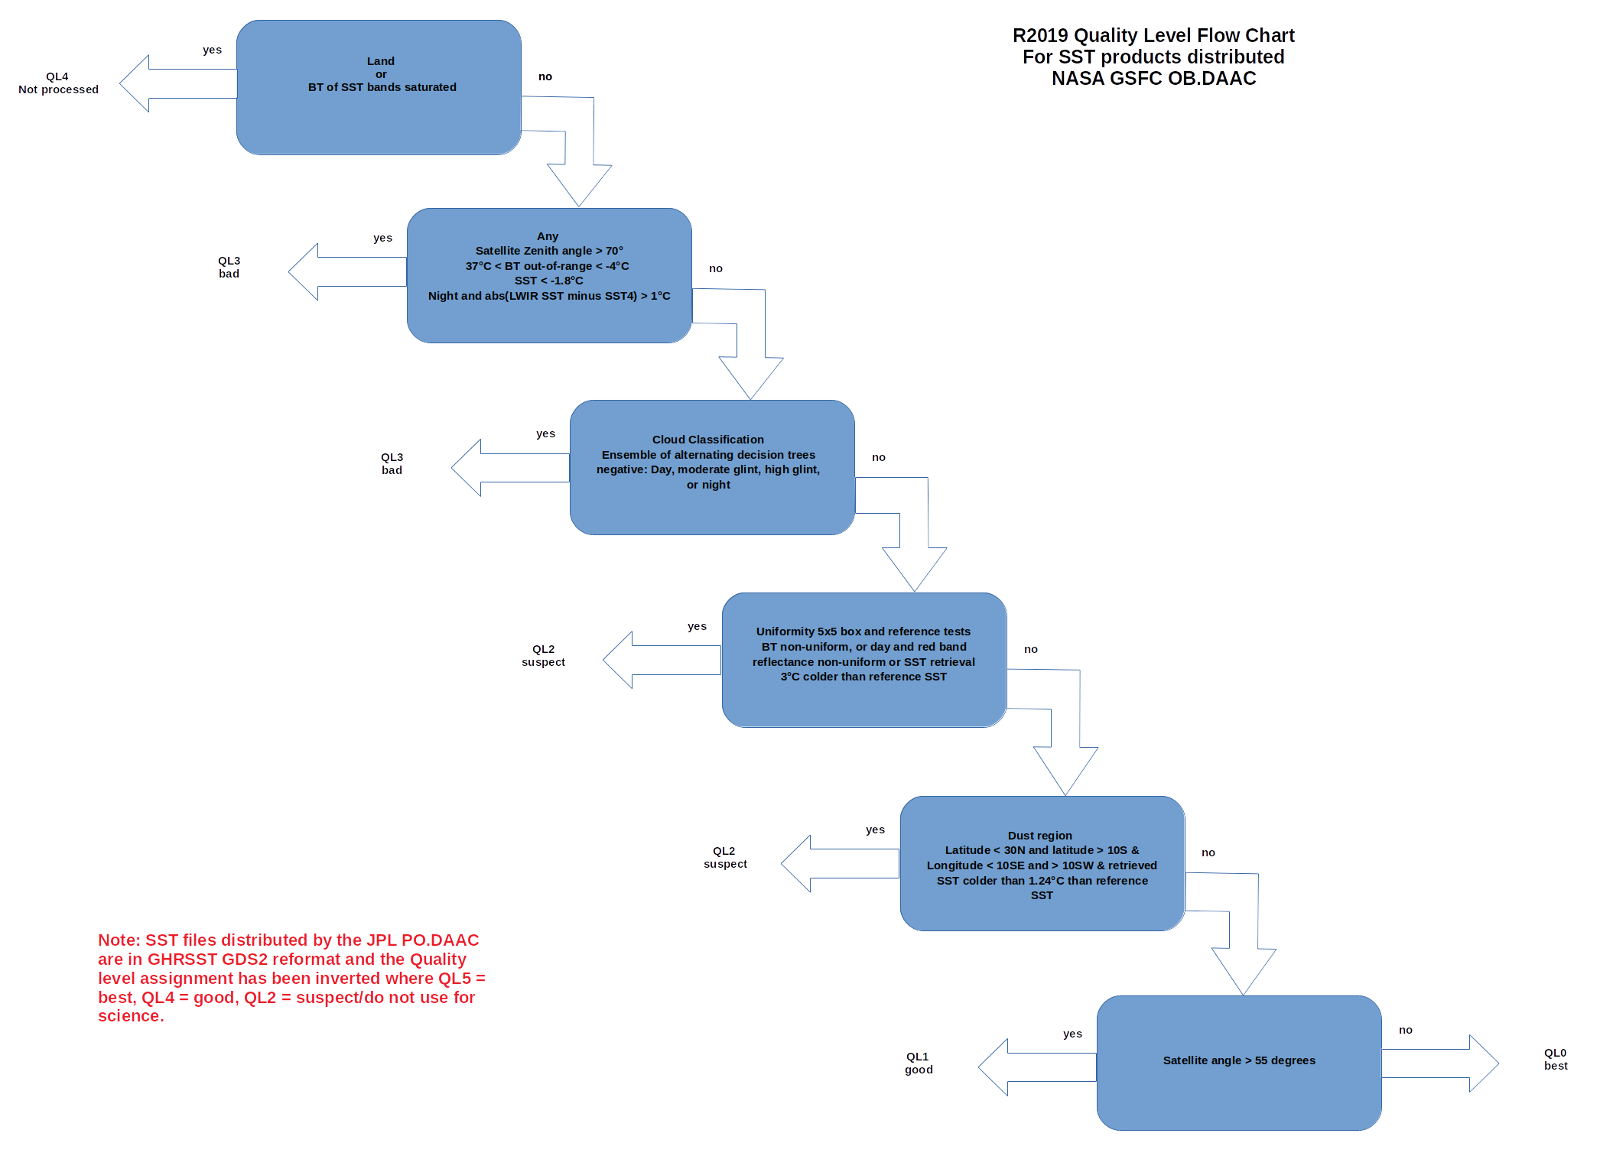
All OB.DAAC files contain a numeric Quality Level for each pixel, assigned by evaluating the test results stored in SST flags, with quality level 0 being the highest quality and quality 4 being the worst. Clear data assigned the highest quality is limited to satellite zenith angles < 55 degrees, where the atmospheric path length is shorter and where error characteristics are better characterized, generally stable, and predictable. Clear pixel at zenith angles > 55 degrees are assigned to good quality1 and are useable, but may have higher uncertainty in the retrieval error. Quality levels > 1 should not be used for scientific studies as they may have significant cloud contamination or a variety of other problems.
| Quality level | Meaning |
|---|---|
| 0 | Best satellite zenith angle < 55 degrees |
| 1 | Good/acceptable but in glint or high viewing angle |
| 2 | Suspect |
| 3 | Bad Cloud/ice/dust or atmospheric correction failed |
| 4 | Not processed or land |
Note: For PO.DAAC L2p GHRSST formatted files the quality/proximity confidence value order is reversed, with 5 “best” and 4 “good” being useable retrievals. Any L2p quality values 3 or less are unacceptable for the NASA IR SST products as described here and should not be used for science purposes. A flow chart of the tests and flags involved with the quality level assignment can be found here.
The cloud mask for NASA MODIS SST4 fields uses a collection of tests to indicate whether a pixel corresponds to clear-sky conditions. For versions R2014 and earlier of MODIS SST4 products, the cloud mask used recursive binary decision trees (BDtrees) (Kilpatrick et al., 2015; Kilpatrick et al., 2001) based on the machine learning classification algorithm of Breiman et. al. (1984). The MODIS R2019 uses a new cloud classification method (Kilpatrick et. al. 2019) based on the classification theory of Alternating Decision Trees (ADtree) (Freund and Mason 1999, Pfahringer et. al. 2000).
There are two types of misclassification errors related to cloud detection in SST products: cloudy pixels misclassified as clear, and clear pixels misclassified as cloud. These two types of error have differing impacts on the SST products. Misclassification of a cloud-contaminated pixel as clear obviously introduces errors in SST retrievals itself; unidentified cloud within a pixel often results in a negative bias in SST (Ackerman et al., 1998). In contrast, an overly conservative cloud mask can introduce significant sampling errors, as many truly cloud-free pixels are excluded from spatially-binned SST fields, leading to incomplete SST coverage. More importantly, the excessive censoring of lower (yet cloud-free) SST values leads to a failure in capturing the true geophysical variability of SST (Liu and Minnett, 2016; Liu at al., 2017; Kilpatrick, 2019). False masking of valid yet anomalously cold sea surface pixels is a pervasive problem for cloud detection algorithms (Merchant et al., 2005).
An advantage of the ADtree classifiers is that they represent an ensemble collection of both weak and strong classifiers with multiple binary decision nodes each ending with a prediction node containing a vote. Each vote is scaled to the predictive power of the test and the collective vote from all true nodes are summed. The magnitude of the ADtree vote then provides an indication of the confidence of the classification. The advantage of using an ADtree classifier to detect clouds, compared to the BDtrees, is that the combined vote from a collection of weak prediction nodes when voting together can modify or override the vote of a single strong prediction node. When the training of an ADtree classifier is also combined with a boosting algorithms, where at each iteration during training the instances that were previously misclassified are pooled together, a more accurate ensemble classification model is possible.
For MODIS SST4 a single Alternating Decision Tree algorithm was trained to classify MODIS retrievals as clear or cloudy, using a subset of data from the buoy Matchup Database (MUDB). Each classification model was validated on independent subsets of the MUDB. Any L2 pixel determined to be cloudy or cloud contaminated is assigned to the lowest quality level 3 and is excluded from the L3 product. The ADtree classifiers used in the R2019 MODIS processing are composed of nested tests. The vote for each individual test found to be True within the tree is summed to form the overall cumulative vote. The sign of the vote indicates the predicted class: negative is cloudy and positive is clear and the magnitude of the vote indicates the confidence of the prediction for the class. Analysis of the training and validation data used in the development of this new cloud masking methodology are presented in Table 2. For R2019 the use of ADtrees reduces the overall misclassification rate, particularly for false positive clouds, increases the number of valid retrievals at L2, and increased the number of populated L3 grid cells compared to R2014.
| AQUA | TERRA | |
|---|---|---|
| % correctly classified | 89.90 | 88.61 |
| % misclassified | 10.70 | 11.30 |
| TP cloud | 0.89 | 0.88 |
| TP clear | 0.89 | 0.89 |
| FP cloud | 0.10 | 0.11 |
| FP clear | 0.11 | 0.12 |
| PRC cloud | 0.96 | 0.96 |
| PRC clear | 0.96 | 0.96 |
Get Single Sensor Error Statistics for:
Get Nonlinear SST Coefficients for:
SST4 products are validated using a collocated MUDB of in situ observations that are collected within 30 minutes of an overpass and 10km of a buoy position. The SST MUDB sets are included in the SEABASS archive. The in situ data sources include both sub-surface in situ observations from drifting and fixed buoys downloaded from the NOAA in situ SST quality monitor (iQuam; Xu & Ignatov 2014), and direct measurements of ocean skin temperatures from ship board Marine-Atmospheric Emitted Radiance Interferometers (M-AERI; Minnett el al., 2001) and Infrared Sea Surface Temperature Autonomous Radiometers (ISAR; Donlon et al., 2018). The M-AERI and ISAR validation provides SI traceability to standards at NIST (National Institute of Standards and Technology; Rice et al. 2004) and NPL (National Physical Laboratory, UK; Theocharous et al., 2019). However, the quantity and geographical coverage of radiometer skin measurements are significantly less than the large number of buoy observations, but which measure a subsurface temperature and have a poorer accuracy.
The multi-dimensional single sensor error statistics (SSES) look-up tables of bias and uncertainty relative to buoys have been updated based on the R2019 validation results. The bias and uncertainty SSES in the GHRSST L2p files are a function of quarter of year, latitude band, satellite zenith angle, brightness temperature difference intervals, temperature intervals, and quality level. Tables 3 and 4 summarize the global statistics of the highest quality retrievals as a function of latitude band for both the current R2014 and R2019 retrievals. Figure 3 shows time series of the medians and robust standard deviations for Aqua MODIS SST4 comparisons with buoy temperatures. Please note that the MUDB is still being reprocessed at the OBPG (March 2020), we will update R2019 tables and figures when the full database has become available. These figures and tables should be considered preliminary figures at this time.
 |
 |

Bernhard, P., Holmes, G., & Kirkby, R. (2001). Optimizing the Induction of Alternating Decision Trees. Proceedings of the Fifth Pacific-Asia Conference on Advances in Knowledge Discovery and Data Mining (2001), Advances in Knowledge Discovery and Data Mining, pp. 477-487.
Breiman, L., Friedman, J., Stone, C.J., & Olshen, R.A. (1984). Classification and regression trees. (pp. 358) Boca Raton, FL, USA.: Chapman and Hall/CRC press. ISBN: 0412048418.
Brown, O. B. & Minnett, P. J. (1999). MODIS Infrared Sea Surface Temperature Algorithm - Algorithm Theoretical Basis Document. University of Miami. 91 pp.
Corlett, G.K., Merchant, C.J., Minnett, P.J., & Donlon, C.J. (2014). Assessment of Long-Term Satellite Derived Sea Surface Temperature Records. In G. Zibordi, C.J. Donlon, & A.C. Parr (Eds.), Experimental Methods in the Physical Sciences, Vol 47, Optical Radiometry for Ocean Climate Measurements (pp. 639-677): Academic Press. 1079-4042. http://dx.doi.org/10.1016/B978-0-12-417011-7.00021-0.
Donlon, C.J., Robinson, I., Casey, K.S., Vazquez-Cuervo, J., Armstrong, E., Arino, O., Gentemann, C., May, D., Le Borgne, P., Piollé, J., Barton, I., Beggs, H., Poulter, D.J.S., Merchant, C.J., Bingham, A., Heinz, S., Harris, A., Wick, G., Emery, B., Minnett, P., Evans, R., Llewellyn-Jones, D., Mutlow, C., Reynolds, R.W., Kawamura, H., & Rayner, N. (2007). The Global Ocean Data Assimilation Experiment High-resolution Sea Surface Temperature Pilot Project. Bulletin of the American Meteorological Society 88, 1197-1213.
Donlon, C., Robinson, I.S., Reynolds, M., Wimmer, W., Fisher, G., Edwards, R., & Nightingale, T.J. (2008). An Infrared Sea Surface Temperature Autonomous Radiometer (ISAR) for Deployment aboard Volunteer Observing Ships (VOS). Journal of Atmospheric and Oceanic Technology 25, 93-113.
Freund, Y. & Mason, L. (1999). The Alternating Decision Tree Learning Algorithm. In Proceedings of the Sixteenth International Conference on Machine Learning (ICML '99), Ivan Bratko and Saso Dzeroski (Eds.). Morgan Kaufmann Publishers Inc., San Francisco, CA, USA, 124-133.
Hanafin, J. A. (2002). On sea surface properties and characteristics in the infrared. Thesis (Ph.D.) University of Miami; Publication Number: AAI3056632; ISBN: 9780493717869; Available at https://search.proquest.com/docview/275785748; 111 pp.
Hanafin, J. A. and P. J. Minnett (2002). Profiling temperature in the sea surface skin layer using FTIR measurements. Gas Transfer at Water Surfaces. edited by M. A. Donelan, W. M. Drennan, E. S. Saltzmann and R. Wanninkhof. American Geophysical Union Monograph 127, 161-166.
Jia, C. (2019). Satellite Infrared Retrievals of Sea Surface Temperature at High Latitudes. MS Thesis, Meteorology and Physical Oceanography. University of Miami. Miami. FL, USA. pp. 79. Available at https://scholarlyrepository.miami.edu/oa_theses/788/.
Jia, C., & Minnett, P.J. (2020). High Latitude Sea Surface Temperatures Derived from MODIS Infrared Measurements Remote Sensing of Environment. In review.
Kilpatrick, K. A. Podestá, G.P., & Evans, R.H (2001). Overview of the NOAA/NASA advanced very high resolution radiometer Pathfinder algorithm for sea surface temperature and associated matchup database. Journal of Geophysical Research. 106(C5):9179-9197. doi: 10.1029/1999JC000065.
Kilpatrick, K.A., Podestá, G., Walsh, S., Williams, E., Halliwell, V., Szczodrak, M., Brown, O.B., Minnett, P.J., & Evans, R. (2015). A decade of sea surface temperature from MODIS. Remote Sensing of Environment 165, 27-41. http://dx.doi.org/10.1016/j.rse.2015.04.023
Kilpatrick, K.A., Podestá, G., Williams, E., Walsh, S., & Minnett, P.J. (2019a). Alternating Decision Trees for Cloud Masking in MODIS and VIIRS NASA Sea Surface Temperature Products. Journal of Atmospheric and Oceanic Technology 36, 387-407. 10.1175/jtech-d-18-0103.1
Kilpatrick, K.A., Minnett, P.J., & Luo, B. (2019b). Improvements in the NASA MODIS R2019.0 Reprocessed SST Products. Presented at XX GHRSST Science Team Meeting, ESRIN, Frascati, Italy.
Liang, X., & Ignatov, A. (2013). AVHRR, MODIS, and VIIRS radiometric stability and consistency in SST bands. J. Geophys. Res. Oceans, 118(6), 3161-3171. doi: 10.1002/jgrc.20205
Liu, Y., & Minnett, P.J. (2016). Sampling errors in satellite-derived infrared sea-surface temperatures. Part I: Global and regional MODIS fields. Remote Sensing of Environment 177, 48-64. doi: 10.1016/j.rse.2016.02.026.
Liu, Y., Chin, T.M., & Minnett, P.J. (2017). Sampling errors in satellite-derived infrared sea-surface temperatures. Part II: Sensitivity and parameterization. Remote Sensing of Environment 198, 297-309. doi: 10.1016/j.rse.2017.06.011.
Llewellyn-Jones, D.T., Minnett, P.J., Saunders, R.W., & Zavody, A.M. (1984). Satellite multichannel infrared measurements of sea surface temperature of the N.E. Atlantic Ocean using AVHRR/2. Quarterly Journal of the Royal Meteorological Society, 110, 613-631
Merchant, C.J., Harris, A.R., Maturi, E. and MacCallum, S. (2005). Probabilistic physically based cloud screening of satellite infrared imagery for operational sea surface temperature retrieval. Quarterly Journal of the Royal Meteorological Society, 131: 2735-2755.
Minnett, P. J. (2010). The Validation of Sea Surface Temperature Retrievals from Spaceborne Infrared Radiometers. Oceanography from Space, revisited., V. Barale, J. F. R. Gower, and L. Alberotanza, Eds., Springer Science+Business Media B.V., 229-247.
Minnett, P.J., & Barton, I.J. (2010). Remote Sensing of the Earth’s Surface Temperature. In Z.M. Zhang, B.K. Tsai, & G. Machin (Eds.), Radiometric Temperature Measurements and Applications (pp. 333-391): Academic Press/Elsevier. ISSN 1079-4042, DOI 10.1016/S1079-4042(09)04306-9.
Minnett, P. J., Brown, O. B., Evans, R. H., Key, E. L., Kearns, E. J., Kilpatrick, K., Kumar, A., Maillet, K.A., & Szczodrak, G. (2004). Sea-surface temperature measurements from the moderate-resolution imaging spectroradiometer (MODIS) on Aqua and Terra. IEEE International IEEE International IEEE International Geoscience and Remote Sensing Symposium, 2004. IGARSS '04. Proceedings. doi: 10.1109/IGARSS.2004.1370173.
Minnett, P. J., and G. K. Corlett (2012). A pathway to generating Climate Data Records of sea-surface temperature from satellite measurements. Deep Sea Research Part II: Topical Studies in Oceanography 77 (2012): 44-51.
Minnett, P. J., Evans, R. H., Podestá, G. P., & Kilpatrick, K. A. (2014). Sea-surface temperature from Suomi-NPP VIIRS: Algorithm development and uncertainty estimation. In Proceedings of SPIE - The International Society for Optical Engineering. (Vol. 9111). [91110C] SPIE. doi: 10.1117/12.2053184.
Minnett, P.J., Knuteson, R.O., Best, F.A., Osborne, B.J., Hanafin, J.A., & Brown, O.B. (2001). The Marine-Atmospheric Emitted Radiance Interferometer (M-AERI), a high-accuracy, sea-going infrared spectroradiometer. Journal of Atmospheric and Oceanic Technology 18, 994-1013.
Nalli, N.R., Joseph, E., Morris, V.R., Barnet, C.D., Wolf, W.W., Wolfe, D., Minnett, P.J., Szczodrak, M., Izaguirre, M.A., Lumpkin, R., & Xie, H. (2011). Multiyear observations of the tropical Atlantic atmosphere: multidisciplinary applications of the NOAA aerosols and ocean science expeditions. Bull. Am. Meteorol. Soc. 92 (6), 765–789.
Pfahringer, B., G. Holmes, & R. Kirkby (2001). Optimizing the induction of alternating decision trees. Fifth Pacific-Asia Conf. on Advances in Knowledge Discovery and Data Mining, Hong Kong, China, PAKDD, 477–487, Available at http://www.cs.waikato.ac.nz/ml/publications/2001/pakdd2001.pdf.
Rice, J.P., Butler, J.J., Johnson, B.C., Minnett, P.J., Maillet, K.A., Nightingale, T.J., Hook, S.J., Abtahi, A., Donlon, C.J., & Barton, I.J. (2004). The Miami2001 Infrared Radiometer Calibration and Intercomparison: 1. Laboratory Characterization of Blackbody Targets. Journal of Atmospheric and Oceanic Technology 21, 258-267.
Selby, J.E.A., F.X. Kneizys, J.H. Chetwynd Jr., & R.A. McClatchey, 1978. Atmospheric Transmittance/Radiance: Computer Code LOWTRAN 4. AFGL-TR-78-0053, Environmental Research Papers, No. 626. Available from NTIS.
Theocharous, E., Fox, N.P., Barker-Snook, I., Niclòs, R., Santos, V.G., Minnett, P.J., Göttsche, F.M., Poutier, L., Morgan, N., Nightingale, T., Wimmer, W., Høyer, J., Zhang, K., Yang, M., Guan, L., Arbelo, M., & Donlon, C.J. (2019). The 2016 CEOS Infrared Radiometer Comparison: Part II: Laboratory Comparison of Radiation Thermometers. Journal of Atmospheric and Oceanic Technology 36, 1079-1092. doi: 10.1175/jtech-d-18-0032.1.
Ward, B. (2006). Near-Surface Ocean Temperature. Journal of Geophysical Research 111, C02005. doi: 10.1029/2004JC002689.
Wong, E.W., & Minnett, P.J. (2018). The Response of the Ocean Thermal Skin Layer to Variations in Incident Infrared Radiation. Journal of Geophysical Research: Oceans, 123, 19pp. doi: 10.1002/2017JC013351.
Xu, F., & Ignatov, A. (2014). In situ SST Quality Monitor (iQuam). Journal of Atmospheric and Oceanic Technology 31, 164-180. doi: 10.1175/JTECH-D-13-00121.1