NASA Educational Workshop
SeaWiFS: Land Processes
Eastern Canada - Summer
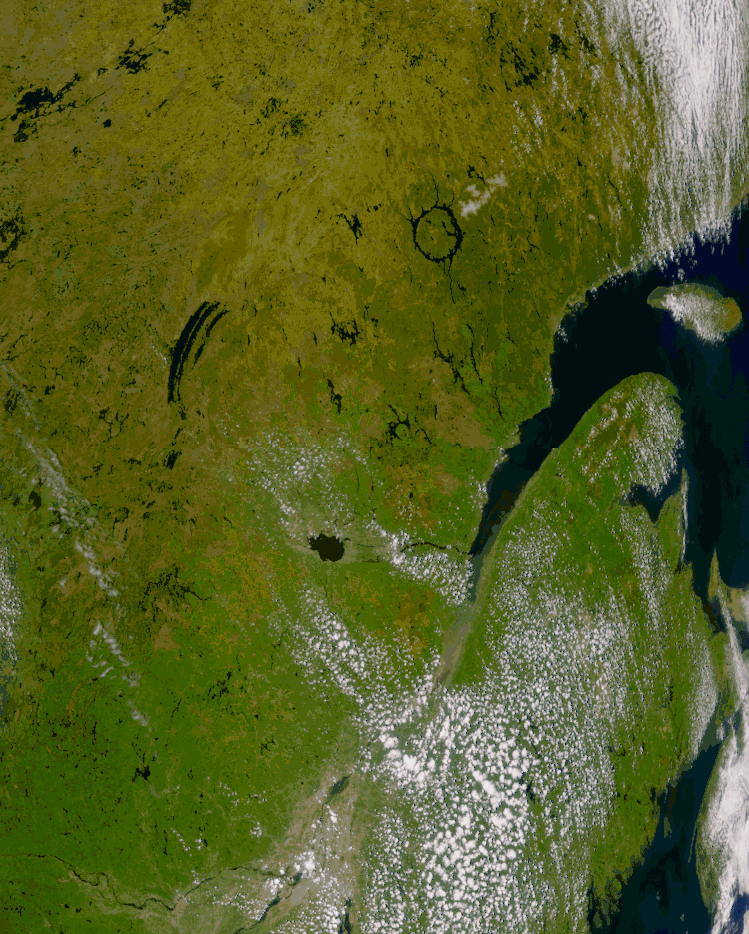
Take a look at the patterns that the vegetation, rivers, and lakes make in this image. From this information, what can you say about the topography of the land? Is this region flat? Or is this region very rugged, with many hills and valleys?
This circular lake represents the remnants of an ancient impact crater (the Manicouagan impact feature). It was formed over 200 million years ago, during the Triassic Period, when a large meteor, travelling several times the speed of sound, struck the Earth forming a large bowl-shaped crater. Is the remnant we see still bowl-shaped? What do you think has happened over 200 million years to modify this crater?
The impact that contributed to the death of the dinosaurs, occurred around 65 million years ago, at the end of the Cretaceous Period, and formed a crater that is about 200 km across. The crater in this image is estimated to have been approximately 100 km in diameter, before it was erroded. Could the crater in this image have contributed to the death of the dinosaurs? How much destruction do you think the crater in this image would have caused?
 |
 |
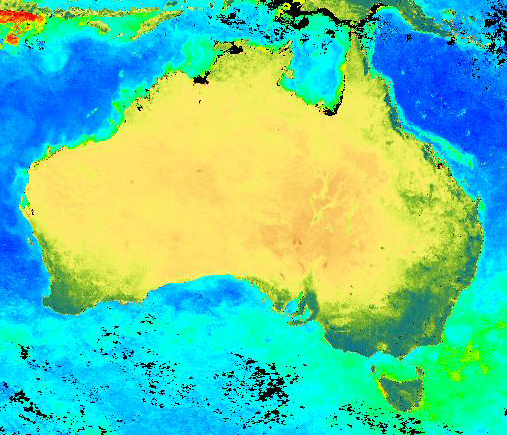
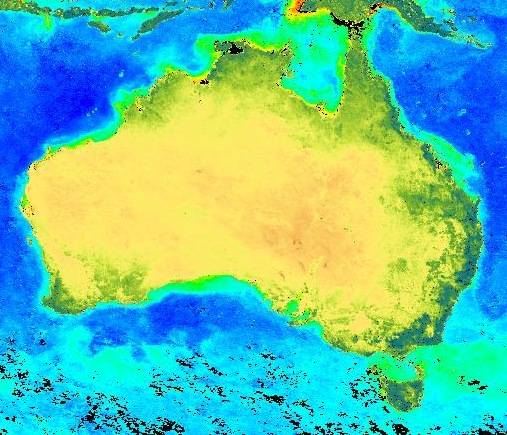
| October 1997 |
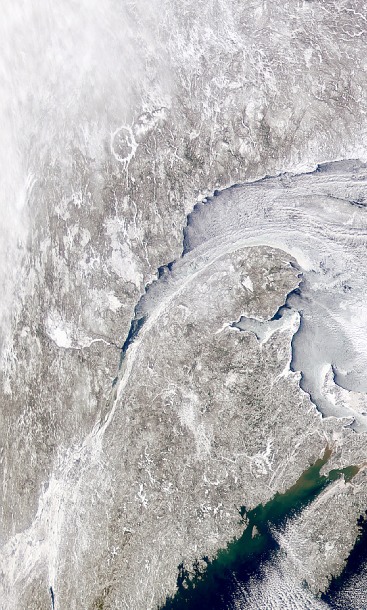
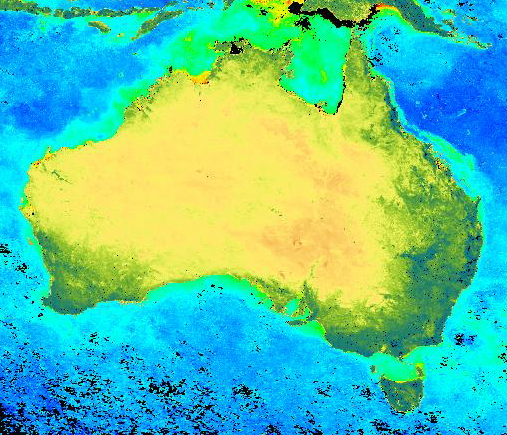
January 1998 |
 |
 |
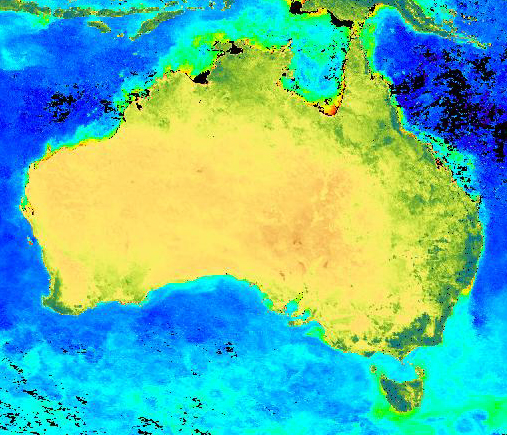
| April 1998 | July 1998 |
![]()
Irene Antonenko(antonenk@seawifs.gsfc.nasa.gov)