SeaWiFS : Producing a "True Color" Image
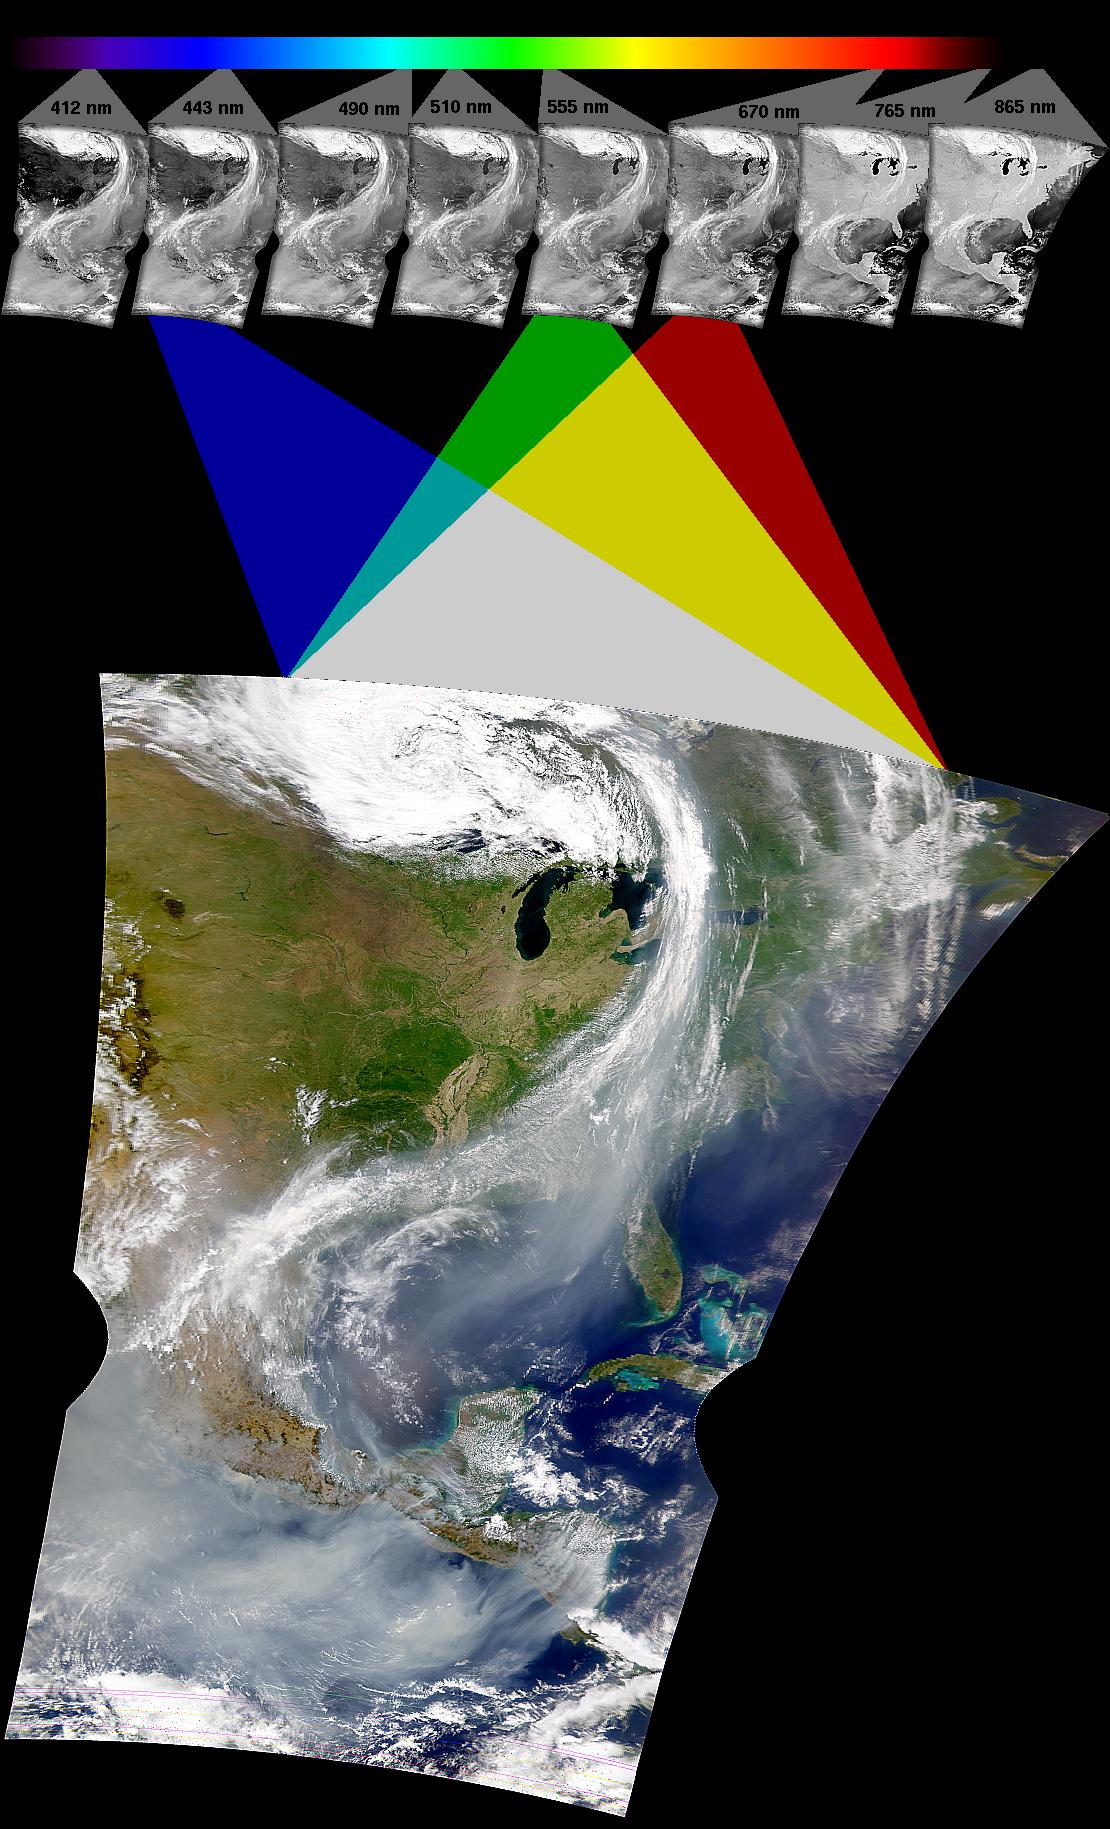
SeaWiFS data are collected in eight (8) different bands in the visible and near infrared part of the electromagnetic spectrum. For each band, the detector measures the intensity of the light that reaches the sensor. When these data are displayed visually, the result is a series of black and white or "gray-scale" images, which look much the same as black and white photographs taken with a series of colored filters over the lense. (Notice how different features have different intensities in the various bands. For example, clouds and water appear bright in the blue and purple bands, while land is dark. In the red and infrared bands, it is the land that is bright, while the water is dark.)
To convert these gray-scale images to a "true color" image, several steps are needed.
Steps to Creating a "True Color" Image
- A "dark correction" is applied to the data.
- When the sensor is pointed at a completely black area, the sensor reading is not zero. This is because stray light from the environment and variations in the detector electronics create small positive readings. To correct for this effect, the sensor periodically takes a reading of a known dark area. This reading is then subtracted from the rest of the data, producing "dark-corrected" data.
- The data are "calibrated."
- What the sensor actually measures is the voltage that results when light photons hit the detector elements. To be useful to scientists, this voltage must be converted to a value that represents brightness, or "radiance." This is done using a complex formula, which is constantly checked and updated.
- A "Rayleigh correction" is applied to the data.
- As the photons of light pass through the atmosphere, they interact with molecules in the atmosphere. This interaction produces what is known as atmospheric scattering, where blue light is preferentially scattered in random directions, which is why the sky appears blue. This scattering component is calculated using the well-known Rayleigh scattering equation and is then subtracted from the data.
- The data are "geolocated."
- Data are collected as a series of points along scan lines, creating a rectangular array of "pixels." The curvature of the Earth's surface and the scanning geometry of the satellite, however, mean that data do not always represent a perfectly rectangular area. To correct for this effect, the exact Earth latitude and longitude of each pixel is calculated and then the data are projected onto a latitude/longitude grid. This makes the data look like a standard Earth map. The various bands in the image above are not rectangular because they have been geolocated and corrected.
- The data are "co-registered."
- For many satellites, data from different bands are taken at slightly different times (microseconds apart), and because the satellite is in motion, the different bands will not all correspond to exactly the same area on the Earth. This means that sharp edges, such as lake shores and cloud boundaries, appear fuzzy and unaligned in the final true color image. To correct for this effect, the bands must be co-registered, so that each pixel of any one band correlates exactly to the same pixel on all of the other bands. This is very easy to do when the data are geolocated; you simply align all the bands according to their latitude/longitude coordinates. This step is not neccessary with SeaWiFS data, because the sensor is designed to collect all eight bands at exactly the same time.
- The data are displayed as an "RGB" image.
- Finally, the three bands that most closely represent red, green, and blue (RGB) in the visible spectrum are combined. Each band is displayed in a monochromatic scale corresponding to its appropriate color. When these are mixed on a computer screen they produce the entire range of visible colors, creating an image that is fairly close to what the human eye and brain would perceive. This is very similar to the way a color TV produces a range of visible colors on the TV screen, using only red, green, and blue dots.


SeaWiFS Project Home Page
Irene Antonenko (antonenk@seawifs.gsfc.nasa.gov)
Image by: Norman Kuring (norman@seawifs.gsfc.nasa.gov)