
This interface provides access to the level-3 products produced and archived by the Ocean Biology Processing Group. You can use it to obtain links to download the data directly, save images as well as to order netCDF data file(s).

The tool is divided into five sections:
Read on or click on the link above to jump to the section for more information on that part of the interface.
It is important to understand the main functions of the browser before exploring the subsequent functions via the blue button(s) at the top of the page. Therefore, the extracting and downloading level 3 data feature is discussed after the other sections listed above are explained.
As you have already discovered, the red button takes you to the browser HELP page ( You are here. ).

The OBPG assigns level-3 products to one of four statuses. Click the heading 'Product Status' to view the status of your product of interest. Category descriptions are as follows:
Your selection will update the thumbnail display as well as populate the instrument selector (shown below) with any instrument that has data matching that category.
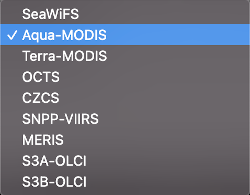
This drop-down menu shows all instruments with data matching the product status selected. Choosing a instrument will update the thumbnails displayed.

The product selector will update automatically with the selection of a instrument. Choosing a product from this list will update the thumbnail display.
The instrument and product selectors, together with the product status selector gives you access to all of the level-3 products in our archive for all of the instruments that we support.
Level-3 products are produced for several different compositing periods. In general, longer time periods fill in more of the naturally occurring data gaps (caused by, for example, clouds, sun glint, inter-orbit gaps, ice, low light, etc.) at the expense of short-lived features, which tend to get smoothed out in longer-period composites.
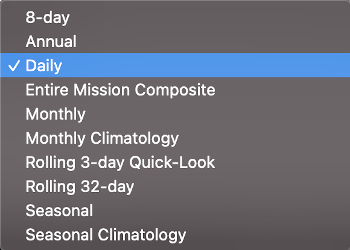
This drop-down menu lets you choose the compositing time period of the currently displayed product. Some products are only available as a subset of the total list of compositing periods which includes the following:
If you don't see one of the above periods in this menu for a particular product, it is because we do not make that type of composite for that product

The Ocean Biology Processing Group produces level-3 products at a few different nominal resolutions. The resolutions are named according to the approximate width of a bin (or pixel) on the Earth's surface at the equator. Most of our products are offered at 9-kilometer resolution, and several are also offered at 4-kilometer resolution; a few experimental regional products are produced at 1-kilometer resolution.
Once you switch resolutions using this drop-down menu, click on the images displayed in the thumbnails section will download PNG files having the newly selected resolution. We normally only archive bin files at the highest available resolution for a given product type, so you will get the same bin file(s) no matter which resolution you have selected.

Use these fields to set the time span the data will cover, using start data to indicate the first day, and end date to indicate the last day in the time span. The default values correspond to the launch date of the mission for start date and the last day of the mission for end date. If the mission is still active, the end date is today's date. Thumbnail images will be added or dropped in coorespondence with these dates.
Thumbnail images of level-3 products are displayed in consecutive sets in chronological order. Click the Previous button, positioned to the left of the platform/instrument heading, to go to an earlier set of thumbnails. When the Next button appears to the right of the heading, it takes you to a more recent set of thumbnails. If the earliest available images are already displayed, then the Previous button will no longer appear on the page. Similarly, if the most recent products from our archive are already displayed, then the Next button will not appear on the page.
To jump to an arbitrary date, use the timeline feature.

The thumbnail images displayed on the level-3 browse interface serve as crude indicators of data coverage and quality for each level-3 product and as links to the corresponding, full-sized PNG images.
When clicked, each thumbnail will enter a slide show view (below) of the image and allow you to download the SMI, BIN, 4km or 9km version of the data by clicking the corresponding links within the image caption. If desired, scroll to the next or previous image by swiping left/right or clicking the arrows that appear when the pointer hovers over the image.

On the top right, beside the 'Zoom' and 'Fullscreen' icons is the Share arrow. This is where the 'Download image' option is found. Use this option if you wish to obtain a PNG file of the data displayed.


The timeline's year and calendar display will update based on the instruments available data period and/or the compositing period selected. The period of available data cooresponds to the mission start and end dates. These mission dates are also the default values in the Start and End date selectors.

The color scale displayed beneath the thumbnails relates the colors in the thumbnails and the PNG images that are downloadable from this site to the geophysical values computed from the remotely sensed data. Unless otherwise noted, pixels colored black indicate that data are unavailable at those image locations. (Note that color scales may not be provided for all test products.)

The Extract or Download L3 Data button at the top, right of the Level-3 Browse interface allows users to get data either by extracting data from a pre-set or user-defined geographical area and/or by downloading any combination of PNG image files, standard mapped image products or binned products.

On this page, the fist row of selectors, as well as the Start/End Date selectors mimic those found on the Level-3 Browser home page. Scroll up to review the functionality of those selectors. Values from the controls on the Level-3 Browser home page are imported into the controls on the Extract or Download Data page.
Additional options are as follows: (these are required fields):

Select the type(s) of data you want to order. The options are:
Any combination of these may be checked. If no option is checked, an error message will be displayed in a red banner.

There are two options for obtaining data:
If Download is selected as your data retrieval method, just click the Download button to get a listing of links to the data matching your criteria. The following is an example of the page that is returned:

You may wish to save these results page as a text file and use it as input to a web downloading program (e.g. wget, cURL) as described on the Ocean Color Forum.
Otherwise, if no records are found that match your criteria, the results page will state: "No data available for {YOUR CRITERIA}."
You must have an Earthdata Login account to extract data from the L3 Browser.
Select Extract as your data retrieval method to get data from a specific region of the globe that you designate on a map. Make sure you have selected some combination of data types before you continue. If data type PNG is checked, an image projections select box will appear below the Data Retrieval Method options. There are six options for type of projection: Plate Carree, Mollweide, Lambert Conformal Conic, Albers Equal Area Conic, Mercador, and EASE-Grid 2.0

Otherwise, your view will look exactly as seen here:

On the map, highlight an area of interest by clicking and dragging the mouse across the map or by typing the N,S,E,W values into the textboxes. Next, click Preview Region (above the map) to show the zoomed-in view of the area. Once you are happy with your selection, click the Review Order button for one last look at your selections.
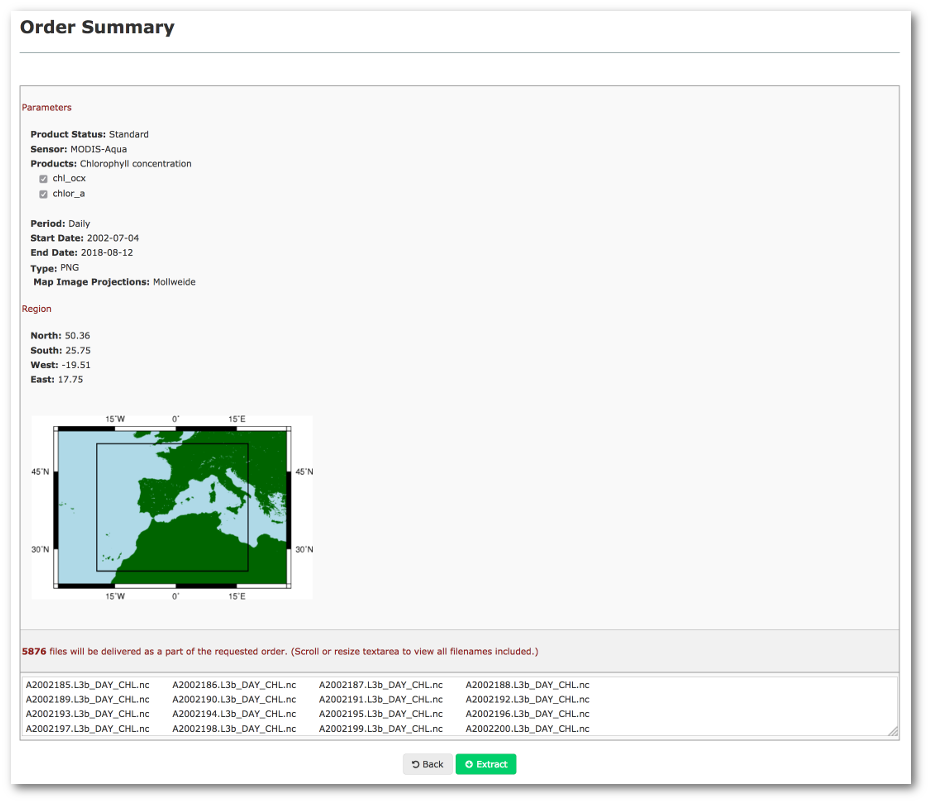
By default, all products within the suite (chl, kd, rrs, ...etc.) are included (selected) with your data. You can deselect any product you wish NOT to recieve. If there are other parameters or regional values you'd like to adjust, use the Back button at the bottom of the display to go back to the previous page. The last section shows the files you should expect to receive as a part of your order. These files correspond to the timeframe you chose using Start and End date selectors. This section is just informational.
Once you are happy with the selections, click the Extract button to request the data...BUT YOU ARE NOT DONE YET!
Be sure to read the verification page/email that follows. It contains further instructions to verify your submission. Completing this step enters your request into the data processing system as a new order.
Last updated: Aug 29, 2023