SST estimates using an infrared radiometer may be contaminated by the presence of dust aerosols in the atmosphere. This algorithm contains an estimate for the VIIRS SST error due to aerosol contamination. The correction is separately derived for the VIIRS sst (day/night) and sst_triple (night-only) products.
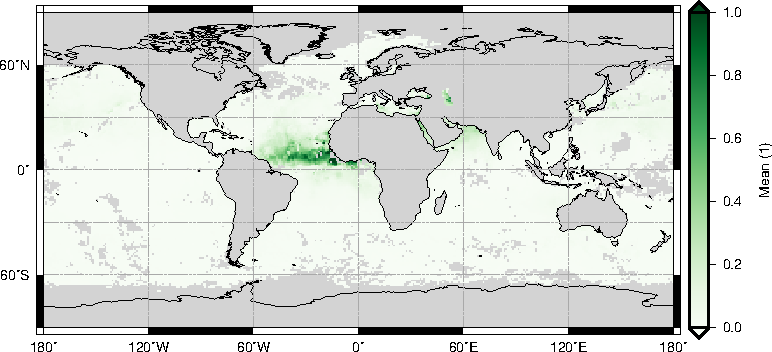
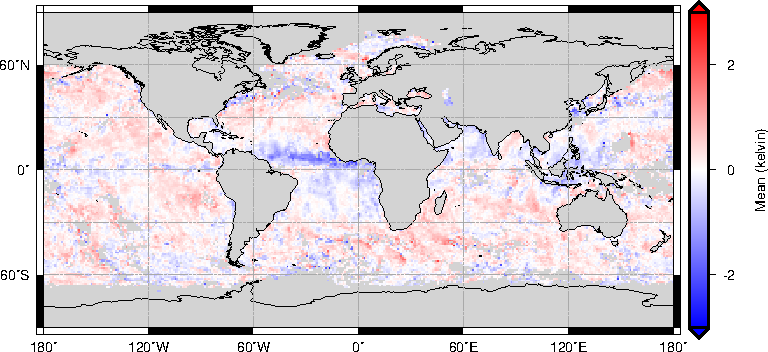
sst - AMSR-2 skin SST for 2014-03-01 to 2014-03-04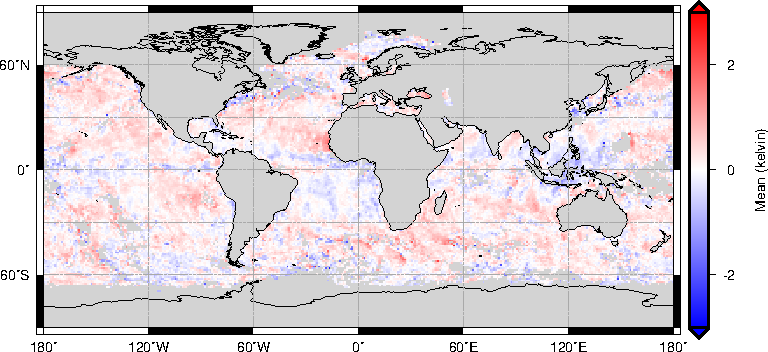
sst - AMSR-2 skin SST for 2014-03-01 to 2014-03-04 after applying aerosol correctionThe SST correction uses the following empirical model:
\[y(x) = t(x) \left[ \alpha \sqrt{x} + \beta \right]\]
where \(y\) is the SST correction in degrees Celsius, \(x\) is the path dust aerosol optical thickness, and \(\alpha\) and \(\beta\) are model coefficients. The taper term \(t(x)\) constrains the correction to zero as the aerosol content decays. It is defined as:
\[ t(x) = \begin{cases} \frac{x}{0.1}, & 0 < x < 0.1 \\ 1, & x \ge 0.1 \end{cases} \]
The aerosol content is not derived directly from the VIIRS data, but is from an ancillary source: the MERRA-2 hourly aerosol diagnostics product, the tavg1_2d_aer_Nx dataset. It contains the dust extinction aerosol optical thickness (AOT) as a columnar quantity. This is converted to a path or slant AOT using the VIIRS satellite zenith angle \(\theta\):
\[ \mathrm{AOT}_{\mathrm{slant}} = \mathrm{AOT}_{\mathrm{columnar}} \, \sec(\theta) \]
The model coefficients are fit in the least-squares sense using collocated VIIRS and AMSR-2 data to estimate the SST error, \(y\), as a function of MERRA-2 dust AOT, \(x\). AMSR-2 is a microwave radiometer and its SST estimates are therefore unaffected by dust aerosols. The values for the model coefficients are:
| OBPG variable | \(\alpha\) | \(\beta\) |
|---|---|---|
sst |
-1.29863 | 0.14308 |
sst_triple |
-0.79862 | -0.06905 |
The two VIIRS SST products are differently affected by aerosols due to the differing combination of channels used. The sst_triple quantity is somewhat less affected by aerosol contamination than the sst quantity.
(To be filled in by the OBPG, if ATBD is accepted)
The SST error due to aerosol contamination is quantified using AMSR-2. The distributions of collocated VIIRS and AMSR-2 SST versus MERRA-2 dust AOT is shown below for a subset of VIIRS data, for both sst and sst_triple.
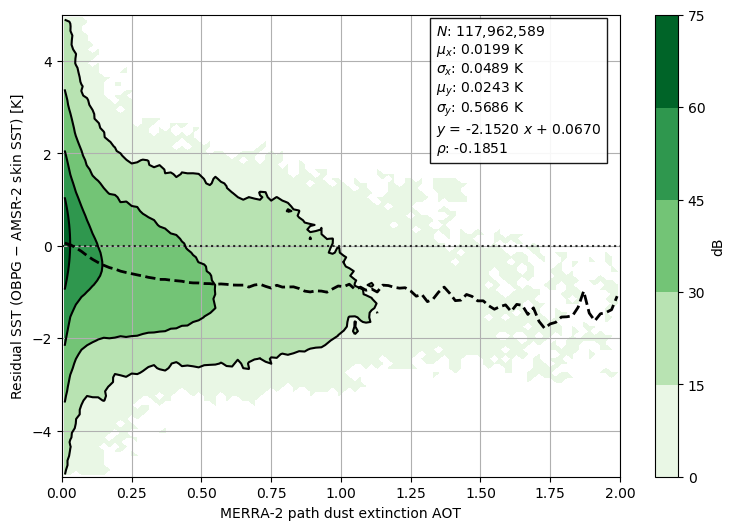
sst (day/night) is used.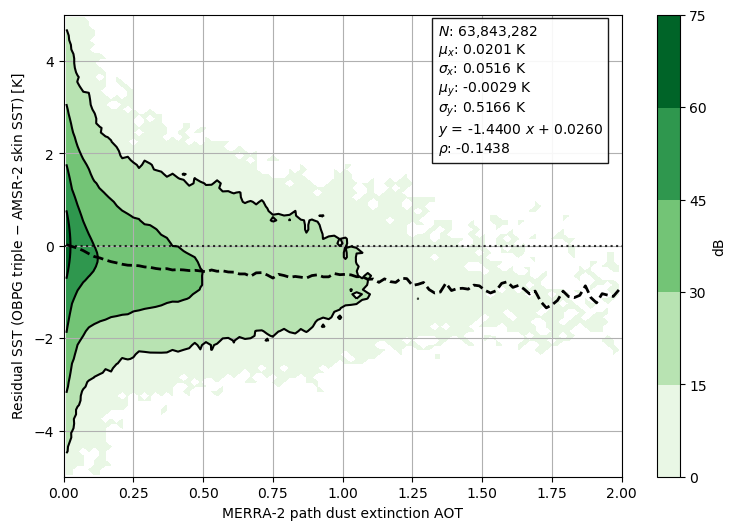
sst_triple (night-only) is used.After applying the SST correction described above, the distributions are shown below.
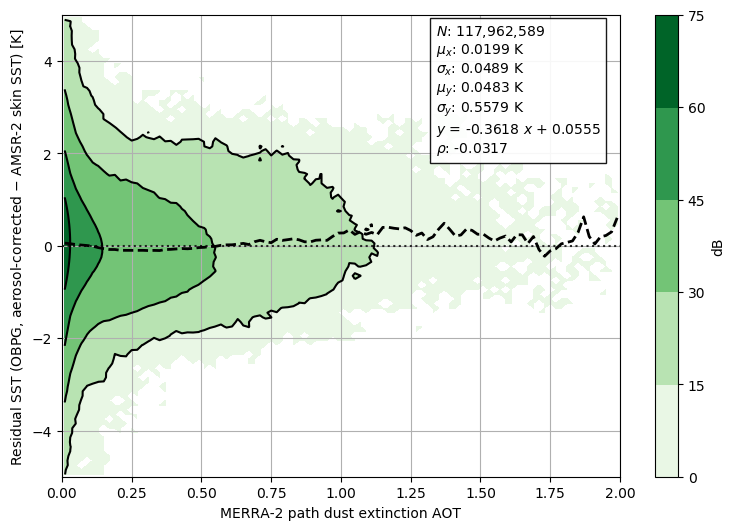
sst (day/night) is used.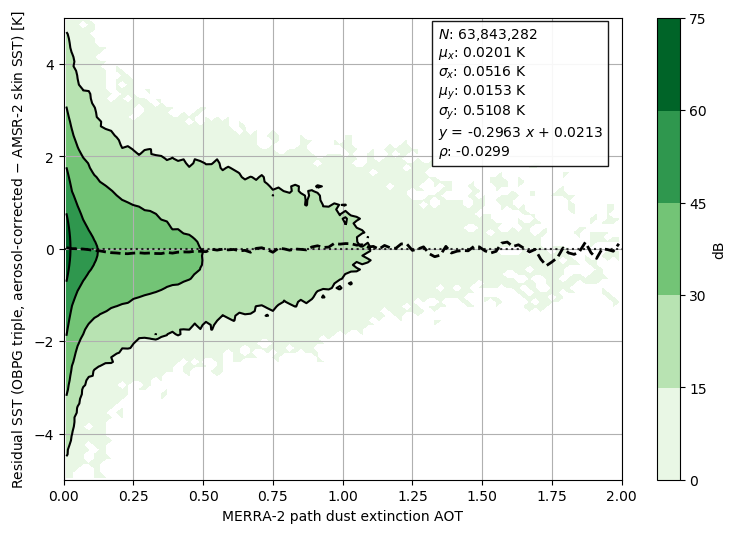
sst_triple (night-only) is used.Lindsley, R. D. (2017). Aerosol Correction of VIIRS SST: Algorithm Theoretical Basis Document. Remote Sensing Systems.