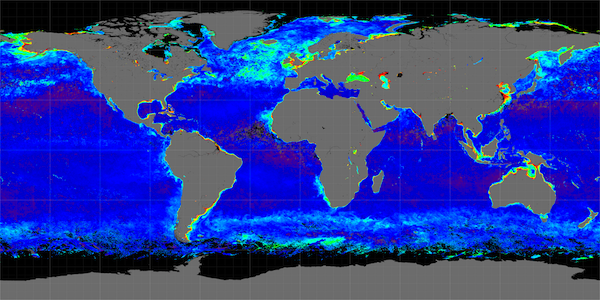
This algorithm derives the concentration of particulate inorganic carbon (PIC) in mol m-3, calculated using observed in situ relationships between water-leaving radiances, spectral backscattering coefficients, and concentrations of PIC (i.e., calcium carbonate or calcite). Algorithm implementation is contingent on the availability of sensor bands near 443 and 555nm. The algorithm is applicable to all current ocean color sensors. The PIC product is included as part of the standard Level-2 OC product suite and the Level-3 PIC product suite.


Algorithm Point of Contact: William Balch and Catherine Mitchell, Bigelow Laboratory for Ocean Sciences
The PIC algorithm is a hybrid of two independent approaches, defined here as the 2-band approach (Balch et al. 2005) and the 3-band approach (Gordon et al. 2001).
2-band approach
Normalized water-leaving radiances in two bands near 443 and 555 nm.
3-band approach
Spectral top-of-atmosphere reflectances at three wavelengths near 670, 750,
and 870 nm
pic, the concentration of particulate inorganic carbon in mol m-3
The algorithm makes use of a precomputed look-up table, derived from in situ measurements, that contains the total backscattering coefficient for calcite at 546 nm, bbc(546) in m-1, as a function of nLw(443) and nLw (555).
In cases where nLw(555) is not available (OCTS, MODIS, MERIS, etc.), it is estimated from the closest native green wavelength (547, 560, and 565 nm, etc.) using the empirical relationships described here.
The 2-band algorithm may fail to retrieve PIC for two primary reasons: 1) the normalized water-leaving radiances could not be retrieved due to atmospheric correction failures or other masking conditions (e.g., clouds or land), and 2) the retrieved water-leaving radiances may be outside the range of values in the precomputed LUT. A common reason for either of these conditions is that the PIC concentration is very high, which can result in large water-leaving radiance signals in the near infrared channels that lead to poor or failed atmospheric correction. In some cases the signal is so strong in the near infrared that the observation is flagged and masked as a cloud.
Observed TOA radiances, Lt(λ) , at three spectral bands near 670, 765, and 865 nm are converted to reflectance and then elated to the components of the radiant path reflectance through:
$\rho_t(\lambda) = (\rho_r(\lambda) + t_s(\lambda)\times \rho_f(\lambda)\times t_s(\lambda)\times \rho_w(\lambda)+\rho_a(\lambda)) t_g(\lambda)$,
where:
ρt(λ) is top-of-atmosphere reflectance (measured),
ρr(λ) is reflectance due to Rayleigh scattering in the
absence of aerosols (calculated), ρf(λ) is reflectance
due to whitecaps and foam (calculated), ts(λ) is
diffuse transmittance of the atmosphere from surface to sensor
(calculated), tg(λ) is atmospheric gas transmittance
Sun to surface to sensor (calculated), ρw(λ) is
water-leaving reflectance (unknown), and ρa(λ) is
aerosol reflectance (unknown).
Aerosol and water-leaving reflectances can be expressed roughly as:
$\rho_a(\lambda)\approx\rho_a(\lambda_0)\times\exp(a\times(\lambda_0-\lambda))$
and
$\rho_w(\lambda)\approx\frac{b_b(\lambda)}{6.179\times(a_w(\lambda)+b_b(\lambda))}$
where:
aw is the absorption coefficient of seawater,
bb is the total backscattering coefficient, and
λ0 = 865 nm. Backscattering by calcite and seawater can be
roughly expressed as:
$b_b(\lambda)\approx b_{bc}(546)\times\left(\frac{546}{\lambda}\right)^{1.35}+b_{bw}(\lambda)$
Through an iterative procedure, seeded by setting the backscattering coefficients to their pure seawater values, values for ρa(865) and a can be retrieved, and ultimately the backscattering coefficient for calcite at 546 nm, bbc(546) can be derived.
Both the 2-band and 3-band approaches calculate the backscattering coefficient for PIC (bbc). The final step for both is to convert to concentration of PIC by dividing bbc by a PIC-specific backscattering coefficient (bbc*). This value was originally taken as 1.628 m2 mol-1. In the reprocessing R2022, this was changed to a variable value, which is applicable to diverse coccolithophore assemblages. The variable bbc* value is based on results from the field that show a strong relationship between high bbc* values in regions of low coccolithophore abundance and lower bbc* values in regions of high coccolithophore abundance. The variable bbc* has a minimum value of 1.28 m2 mol-1.
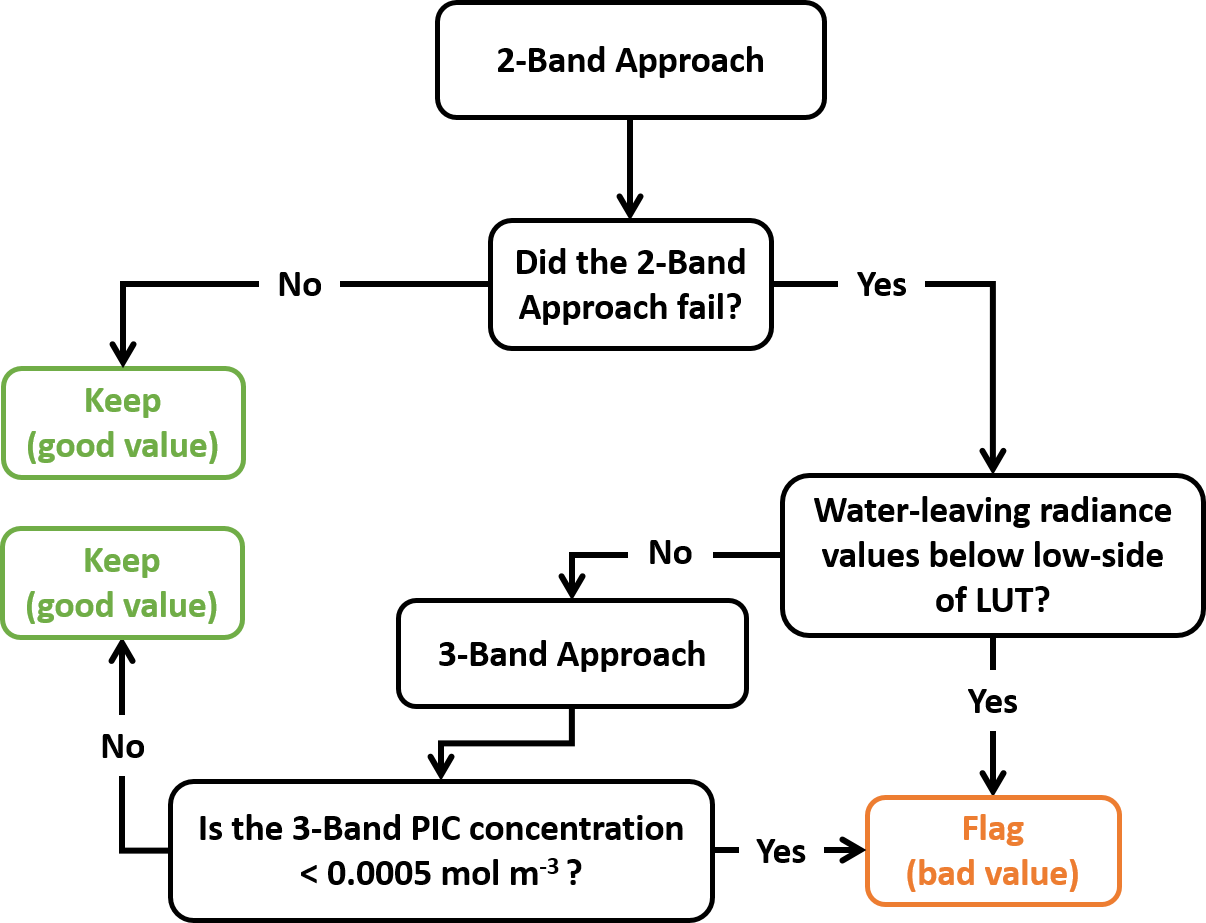
The 2-band approach is calculated in all cases. The lowest acceptable PIC value from the 2-band approach is 1 x 10⁻⁵ mol m-3 based on field observations (prior to R2022, the lowest acceptable PIC was 1.18 x 10⁻⁵ mol m-3). For the 2-band approach, if the water-leaving radiance values are lower than any of the radiance values in the precomputed LUT, the 2-band approach fails and the pixel is flagged as a bad value. If the 2-band approach fails for any other reason, the 3-band approach is called. If the 3-band approach yields a PIC concentration >= 0.0005 mol m-3, the value is kept. If the 3-band approach yields a PIC concentration < 0.0005 mol m-3, the value is flagged as a bad value. See flowchart for overview.

As noted, the 2-band algorithm uses a common look-up table define for nLw(443) and nLw(555), and adjusts the satellite nLw retrievals as needed to account for sensor-specific differences in center wavelength relative to the look-up table indices. For the 3-band approach, the atmospheric properties and water optical properties are computed at the sensor specific band passes in the red and near-infrared, and thus the sensor differences are inherent in the implementation. The actual wavelengths used for the various sensors are shown in the table below, with the 3-band algorithm center wavelengths in parentheses.
| SeaWiFS | 443, 555 (670, 765, 865) |
| MODIS | 443, 547 (667,748,869) |
| MERIS | 443, 560 (665, 779, 865) |
| VIIRS | 443, 551, (671, 751, 862) |
The PIC product is not computed if the Level-2 flags indicate LAND, HIGLINT, HILT or CLOUDS. A failure condition is indicated in Level-2 by setting the PIC value for that pixel to the _FILLVALUE and setting the Level-2 flags to indicate PRODFAIL.
| Product Short Name | pic |
| Level-2 Product Suite | OC |
| Level-3 Product Suite | PIC |
| Level-3 Masking | ATMFAIL,LAND,HISATZEN,STRAYLIGHT,CLDICE,LOWLW, NAVWARN,ATMWARN, HISOLZEN,NAVFAIL,FILTER,HIGLINT,HILT |
For further details go to the algorithm source code or the dependency graph of the algorithm implementation in the NASA ocean color processing code (l2gen).
A limited set of Level-2 satellite-to-in-situ match-up validation results are available for each sensor from the validation tool of the SeaWiFS Bio-Optical Archive and Storage System (SeaBASS). Links to those match-ups are provided below.
Balch, W. M., Gordon, H. R., Bowler, B. C., et al. (2005).. Calcium carbonate measurements in the surface global ocean based on Moderate-Resolution Imaging Spectroradiometer data. Journal of Geophysical Research 110, C07001. http://dx.doi.org/10.1029/2004jc002560
Gordon, H. R., Boynton, G. C., Balch, W. M., et al. (2001). Retrieval of coccolithophore calcite concentration from SeaWiFS imagery. Geophysical Research Letters 28(8), 1587-1590. http://dx.doi.org/10.1029/2000gl012025